Watch the pile, not the stock statement.
Raw Material Stocks reads the ore, coal, log, clinker and feedstock piles at the supplier sites you name, week by week. A shortage shows up as a shrinking heap in your record before it shows up as a late phone call.
- GSD
- VHR, 0.5 m or finer
- Cadence
- Weekly
- Platform
- VHR satellite or aerial
- Spectral
- RGB
The call that comes after the shortage
The supplier's stock statement is theirs to send. It arrives late, and it says what they decided to say. Between statements you have the contract, the call-off schedule, and whatever your sales contact tells you on Thursday. Everything is fine until a delivery slips. Then comes the explanation: the quarry had a wet spell, the kiln was down, the haul road was shut. By then the pile has been low for weeks, and you are the last to know.
So you do what a buyer does. You ask the planner to check inbound against the schedule. You ask the trader whether anyone has heard anything at the port. You think about a site visit, which shows you one day and costs a trip. Meanwhile you are looking for replacement tonnage, and the spot price may already have moved.
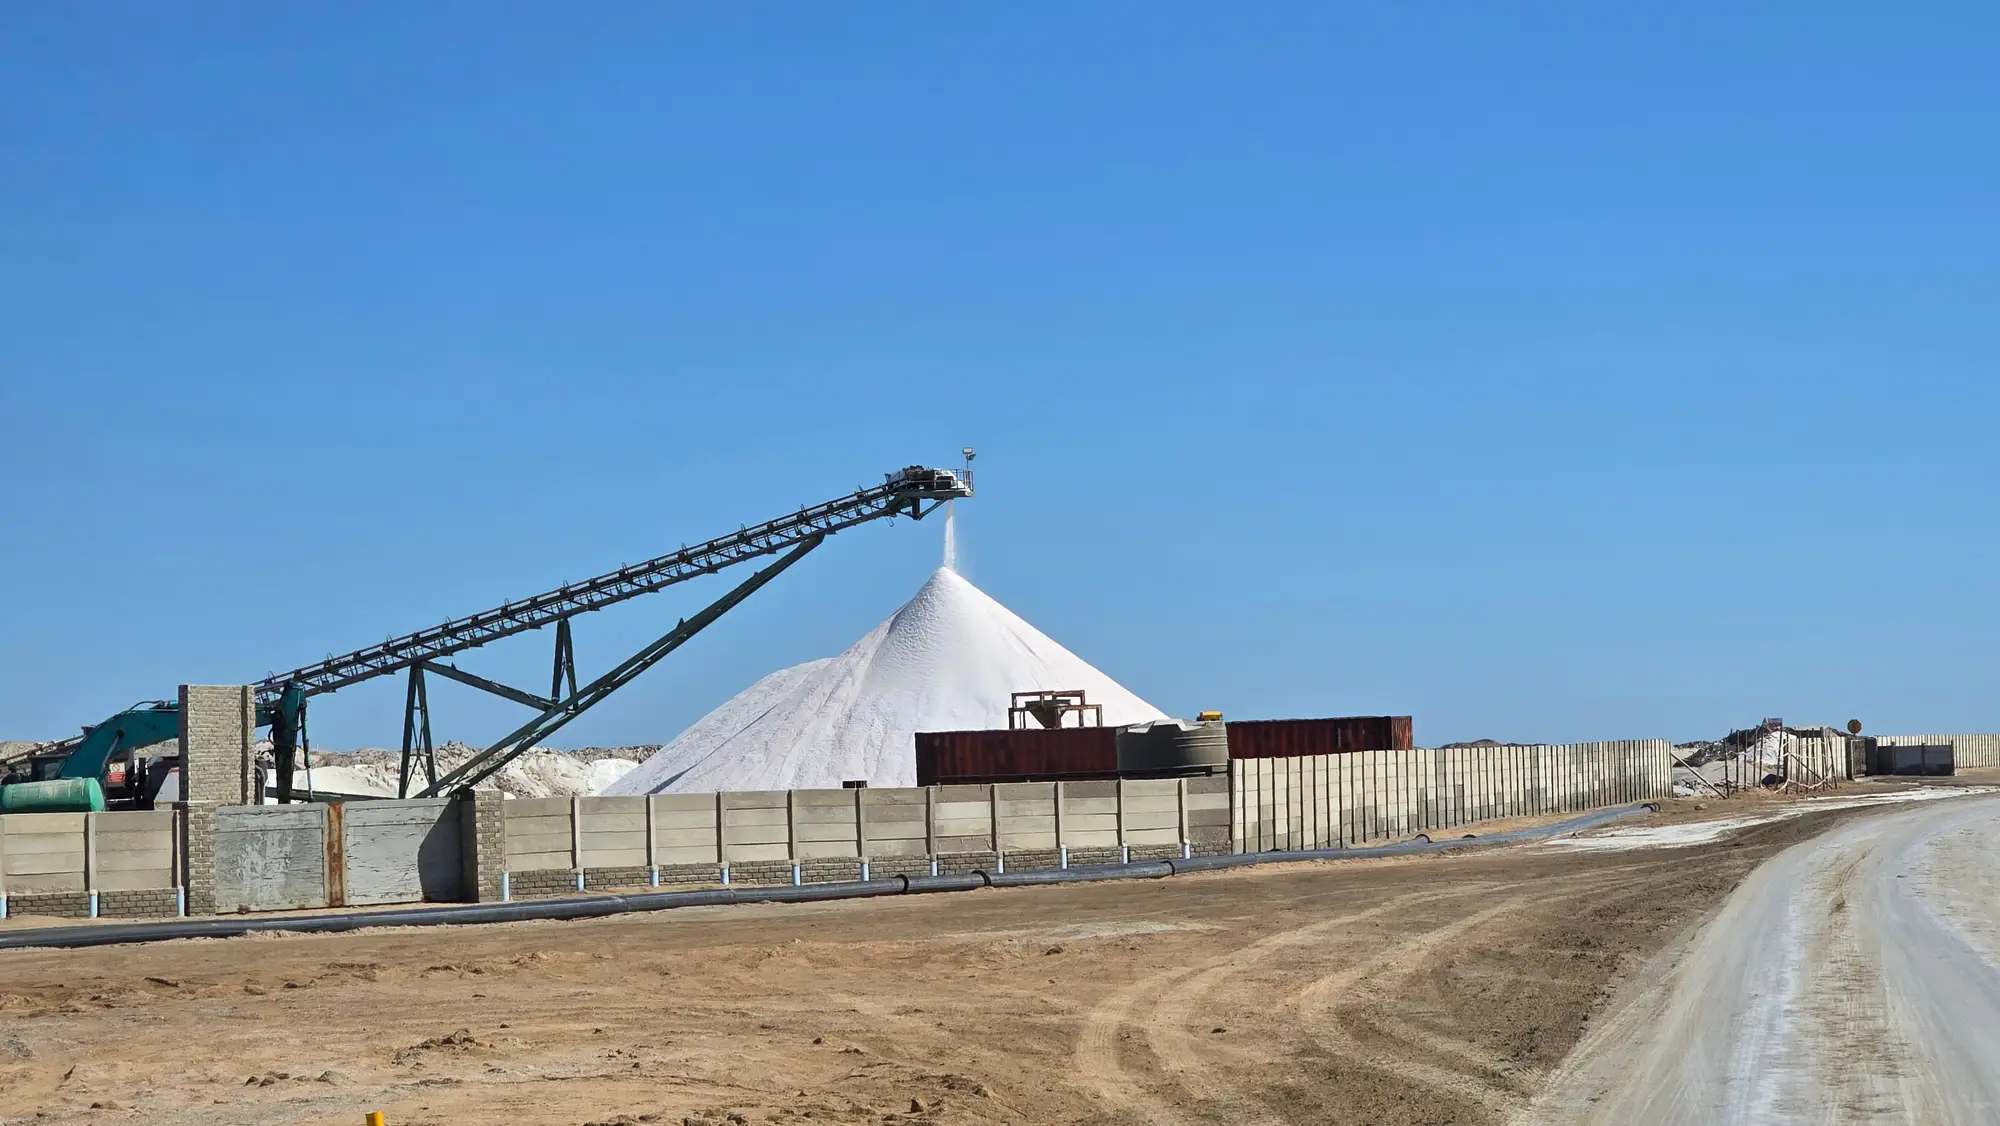
An open pile is visible from above the whole time. Raw Material Stocks puts a weekly figure on it, for the sites and piles you name, so the drawdown is on your desk while the supplier is still saying everything is on track.
What lands each week
A weekly record for each site you name, in a format your spreadsheet or BI tool opens.
2.1Pile volumeCSV
One volume figure per named pile per week, with the date of the imagery behind it.
2.2Week-over-week changeCSV
The difference from last week's figure for the same pile, for each pile. A pile that falls week after week is the thing to put in front of the category manager.
2.3Site logRunning record
The weekly figures for each site kept in one place, so a drawdown reads as a line in your own record and you can show the dates when you open a sourcing conversation.
How it works
Before the first pass
Name the site and the piles
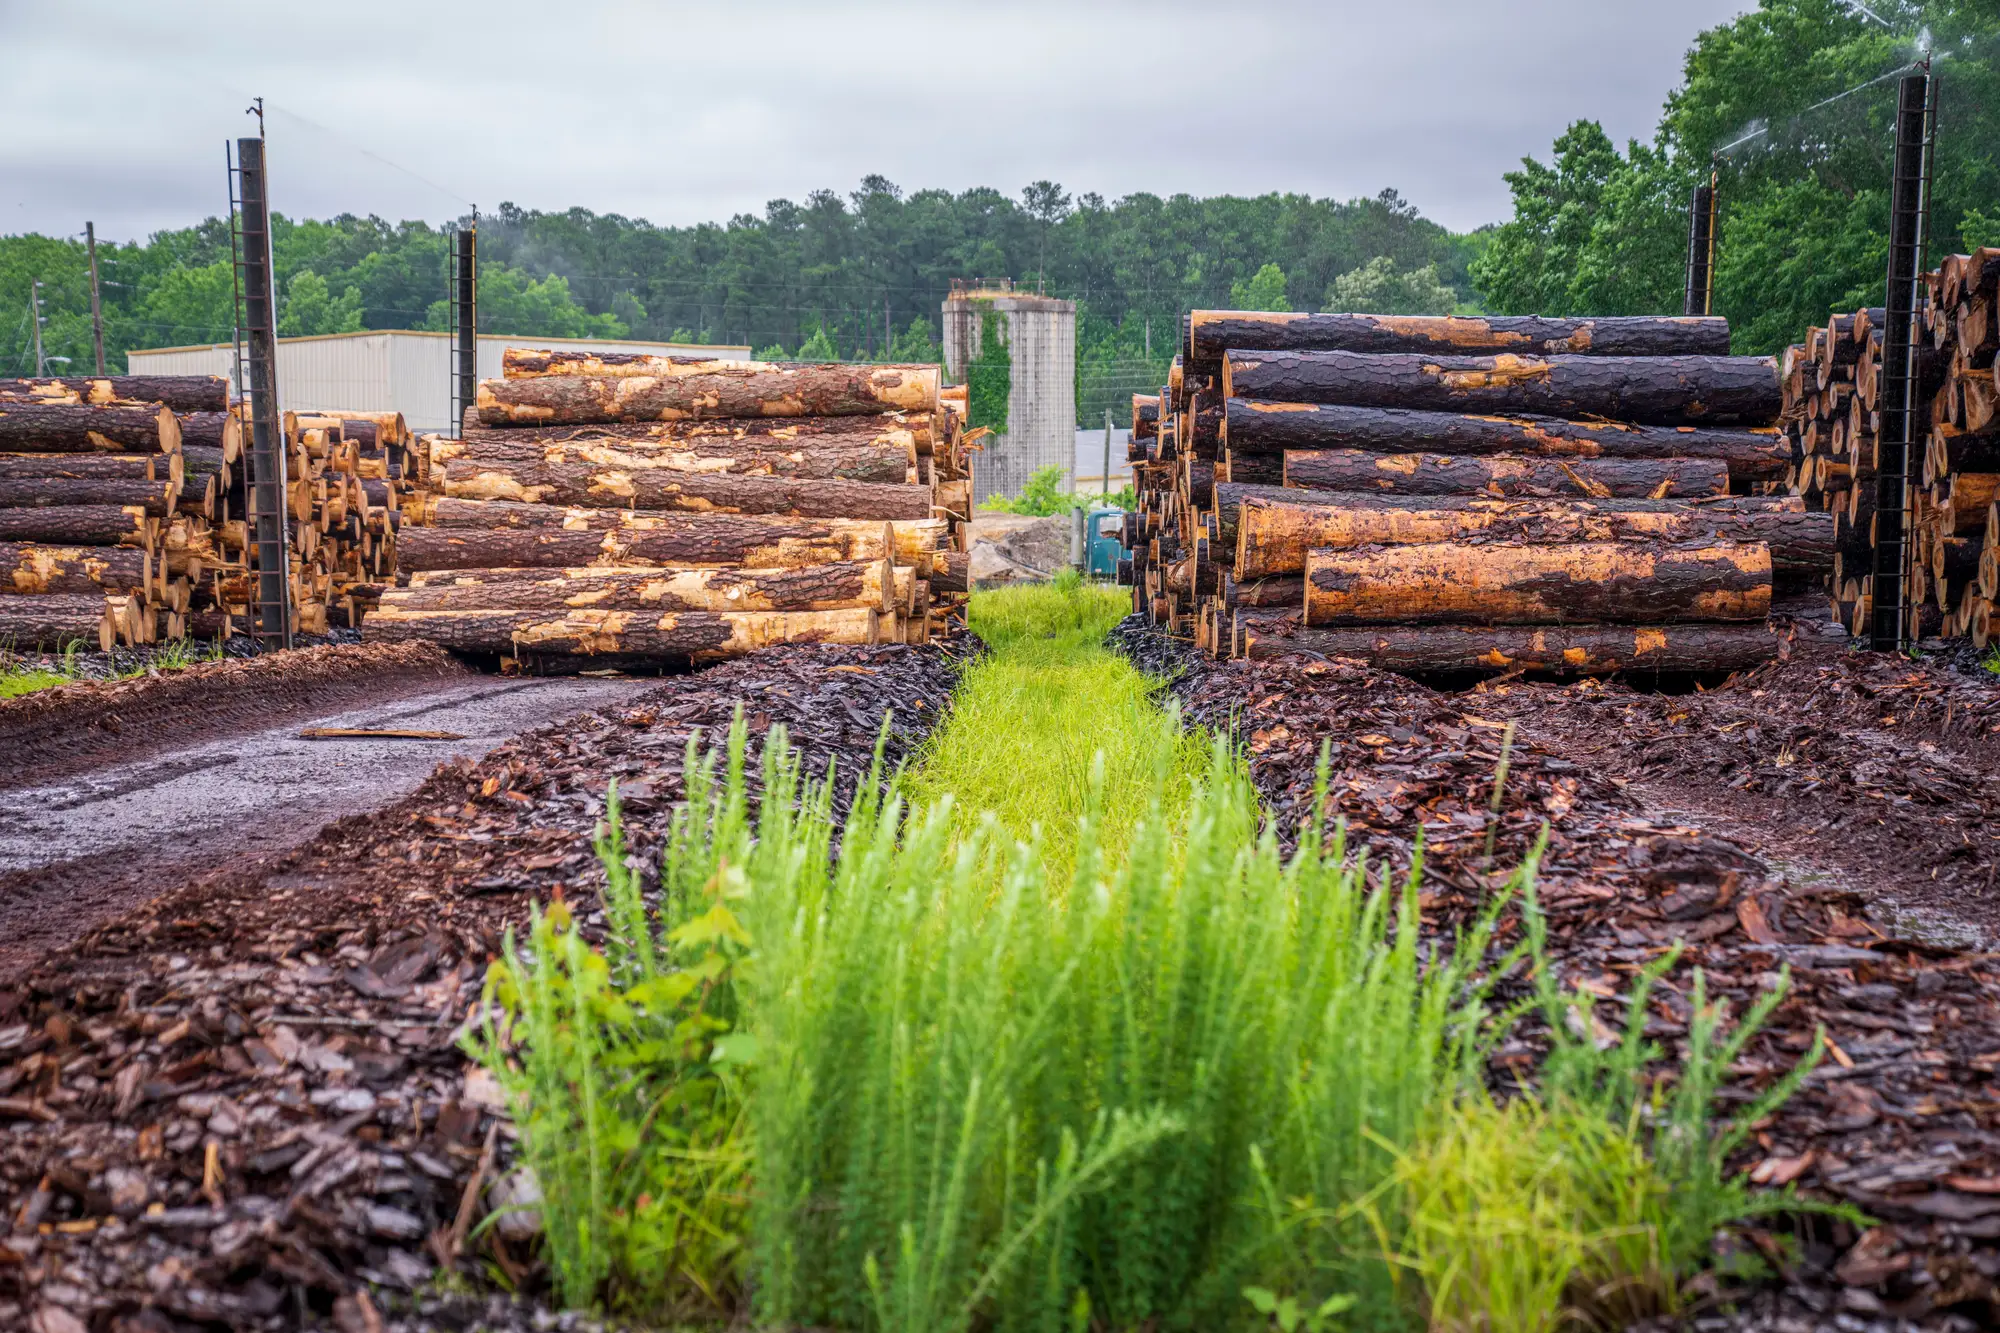
Tell us the supplier site and which piles you care about: the coal heap at the power station, the clinker pile at the cement works, the log deck at the mill. A list of named piles with a rough location in the yard is enough.
Every week
A weekly imagery pass
Very high resolution imagery over the yard, from satellite or aerial, taken once a week where the sky allows.
Every week
We measure each pile
Pile extent is measured from the imagery and a volume estimated for it. The same method runs on the same pile every week, which is what makes the weeks comparable.
Every week
The number and the change arrive
Your volume figure per pile and the week-over-week change, added to the site log.
Where it fits
A pile that keeps trending down is your cue to open a sourcing conversation before the supplier raises it. The weekly read sits next to the supplier stock statement and the call-off schedule.
You bring it to the weekly supply call and to the monthly planning meeting, and to the supplier review when you want to ask about a pile with dates attached.
Limits
Open piles only
Covered stores, silos, domes and indoor storage can't be measured from above. If your supplier keeps the material under a roof, this page isn't for that material.
A trend, not a tonnage
The figure is an imagery-based estimate. It is consistent from week to week, which is what a drawdown needs. It is no certified survey and it isn't a stock count you could sign for. Read the direction, and don't treat the last digit as exact.
Cloud skips a week
Optical imagery needs a clear view of the yard. A cloudy week is skipped and picked up on the next clear pass, so the weekly cadence is a target, and a gap in the record can run longer than a week.
Pile size sets what's visible
At 0.5 m or finer a pixel is small enough to outline a stockpile, but a small pile gives a rough volume. Say which piles matter and we'll tell you if the imagery can read them.
Only the piles you name
You get the sites and piles you list. We don't search a yard for stock you didn't point to, and we don't tell you what the supplier plans to do about a low pile.
Who it's for
A fit if
- You buy ore, coal, logs, clinker or similar bulk feedstock from a supplier that holds it in an open yard.
- You are responsible for supply continuity, and you want the pile in front of you before the supplier raises a problem.
- You want a weekly figure per pile and the change since last week, in a spreadsheet.
Not a fit if
- Your supplier stores the material indoors, in silos or under cover.
- You need a certified stock count for an audit or a financial statement.
- You need a number by the hour, or a daily record.
- You want a forecast of when the supplier will run out.
Questions before a pilot
How accurate is the volume?
We don't publish a fixed accuracy figure. It's an estimate from imagery, measured the same way each week, and it is best read as a trend. If you have a recent stock count from the site, you can hold the pilot's figures up against it.
Can you see inside covered storage?
No. Only piles visible from overhead are measured. Indoor, covered or silo stock isn't.
What happens when it's cloudy?
That week's pass is skipped and the next clear one fills the gap. The record shows the date of the imagery behind each figure, so you can see how old a number is.
Which materials work?
Ore, coal, logs, clinker and similar bulk feedstock sitting in open yards. If you have a material that isn't on that list, ask and we'll look at a sample yard.
How is a pilot set up?
You name a supplier site and the piles. We scope the pilot around them, including how many weeks it runs and which sites it covers, and agree that with you before the first pass.
Does the supplier know we're watching?
The imagery is of the yard from above. What you tell the supplier about your monitoring is your call, and your contract with them may have its own terms on information. Check with your legal team before you rely on a read in a negotiation.
Can we see this in our spreadsheet or BI tool?
You get the weekly figures as a CSV, which opens in a spreadsheet and loads into anything that reads CSV. There's no direct integration with an ERP or a supplier portal.
Who owns the data, and how is it priced?
What you can do with the figures, and the licence on the imagery behind them, goes into the pilot agreement before the first week. Pricing depends on how many sites and piles you want and for how long, so we quote once we know them. There is no price list on this page.
Name the first pile you'd like tallied.
Tell us the supplier site and the pile. We'll scope a pilot around it.